> DOWNLOAD PDF (21MB)
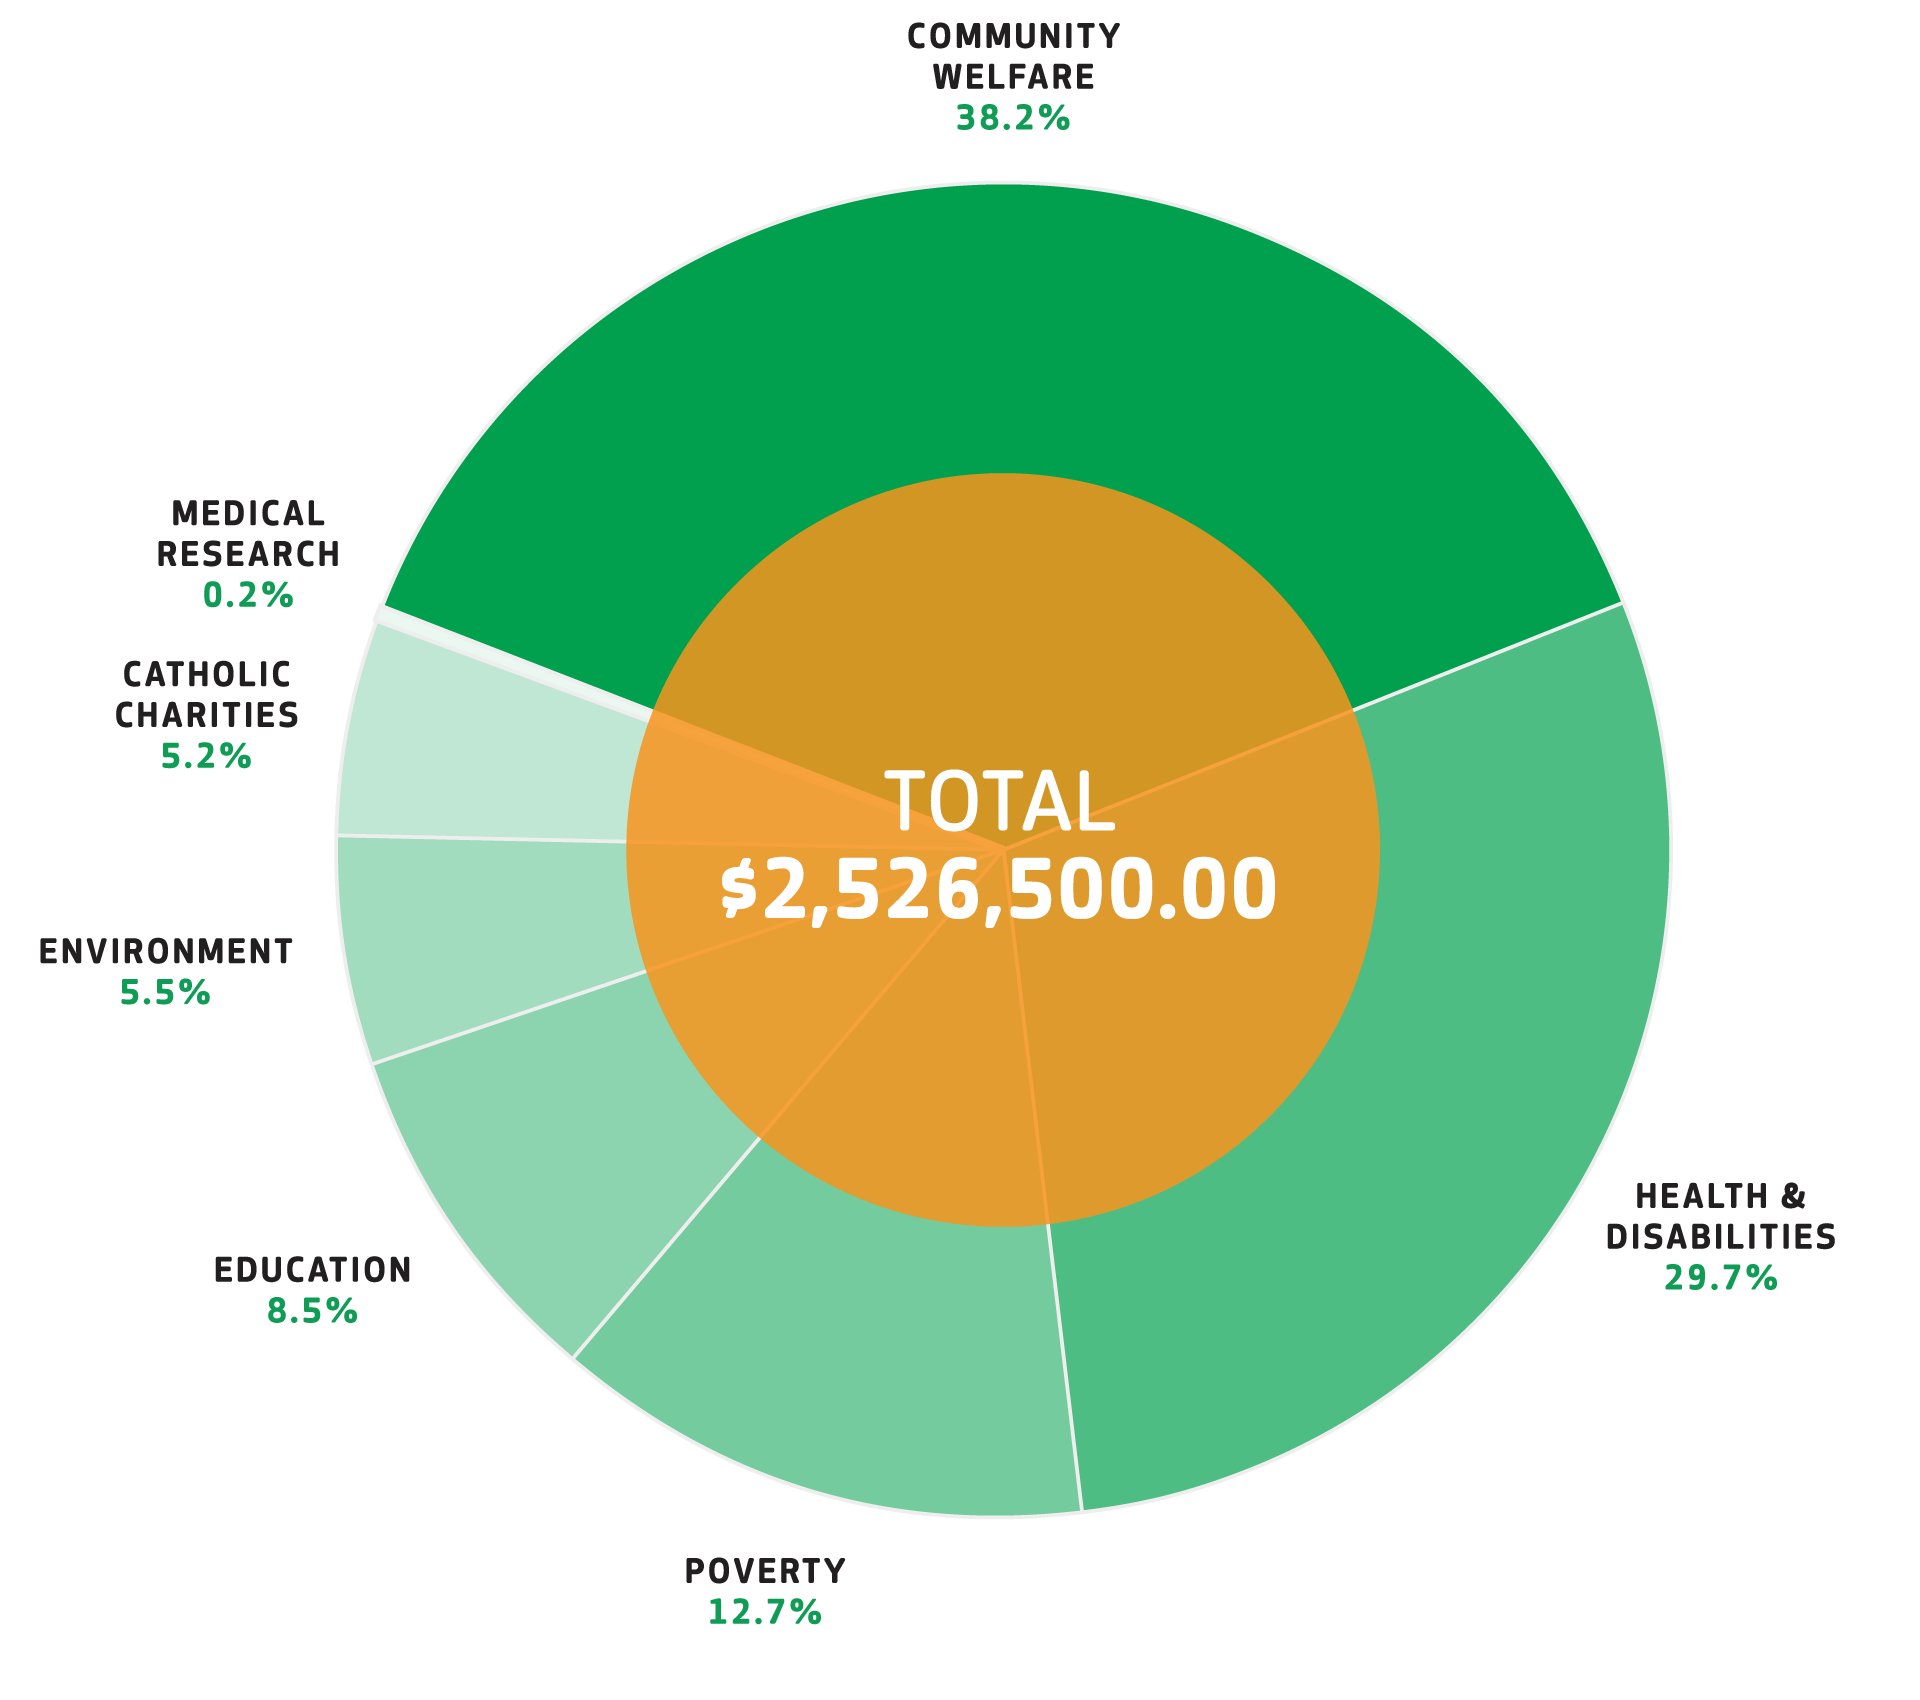
$964,900.00Community Welfare (38.2%)
$751,350.00Health & Disabilities (29.7%)
$320,500.00Poverty (12.7%)
$215,000.00Education (8.5%)
$139,250.00Environment (5.5%)
$130,500.00Catholic Charities (5.2%)
$5,000.00Medical Research (0.2%)
> DOWNLOAD PDF (16MB)
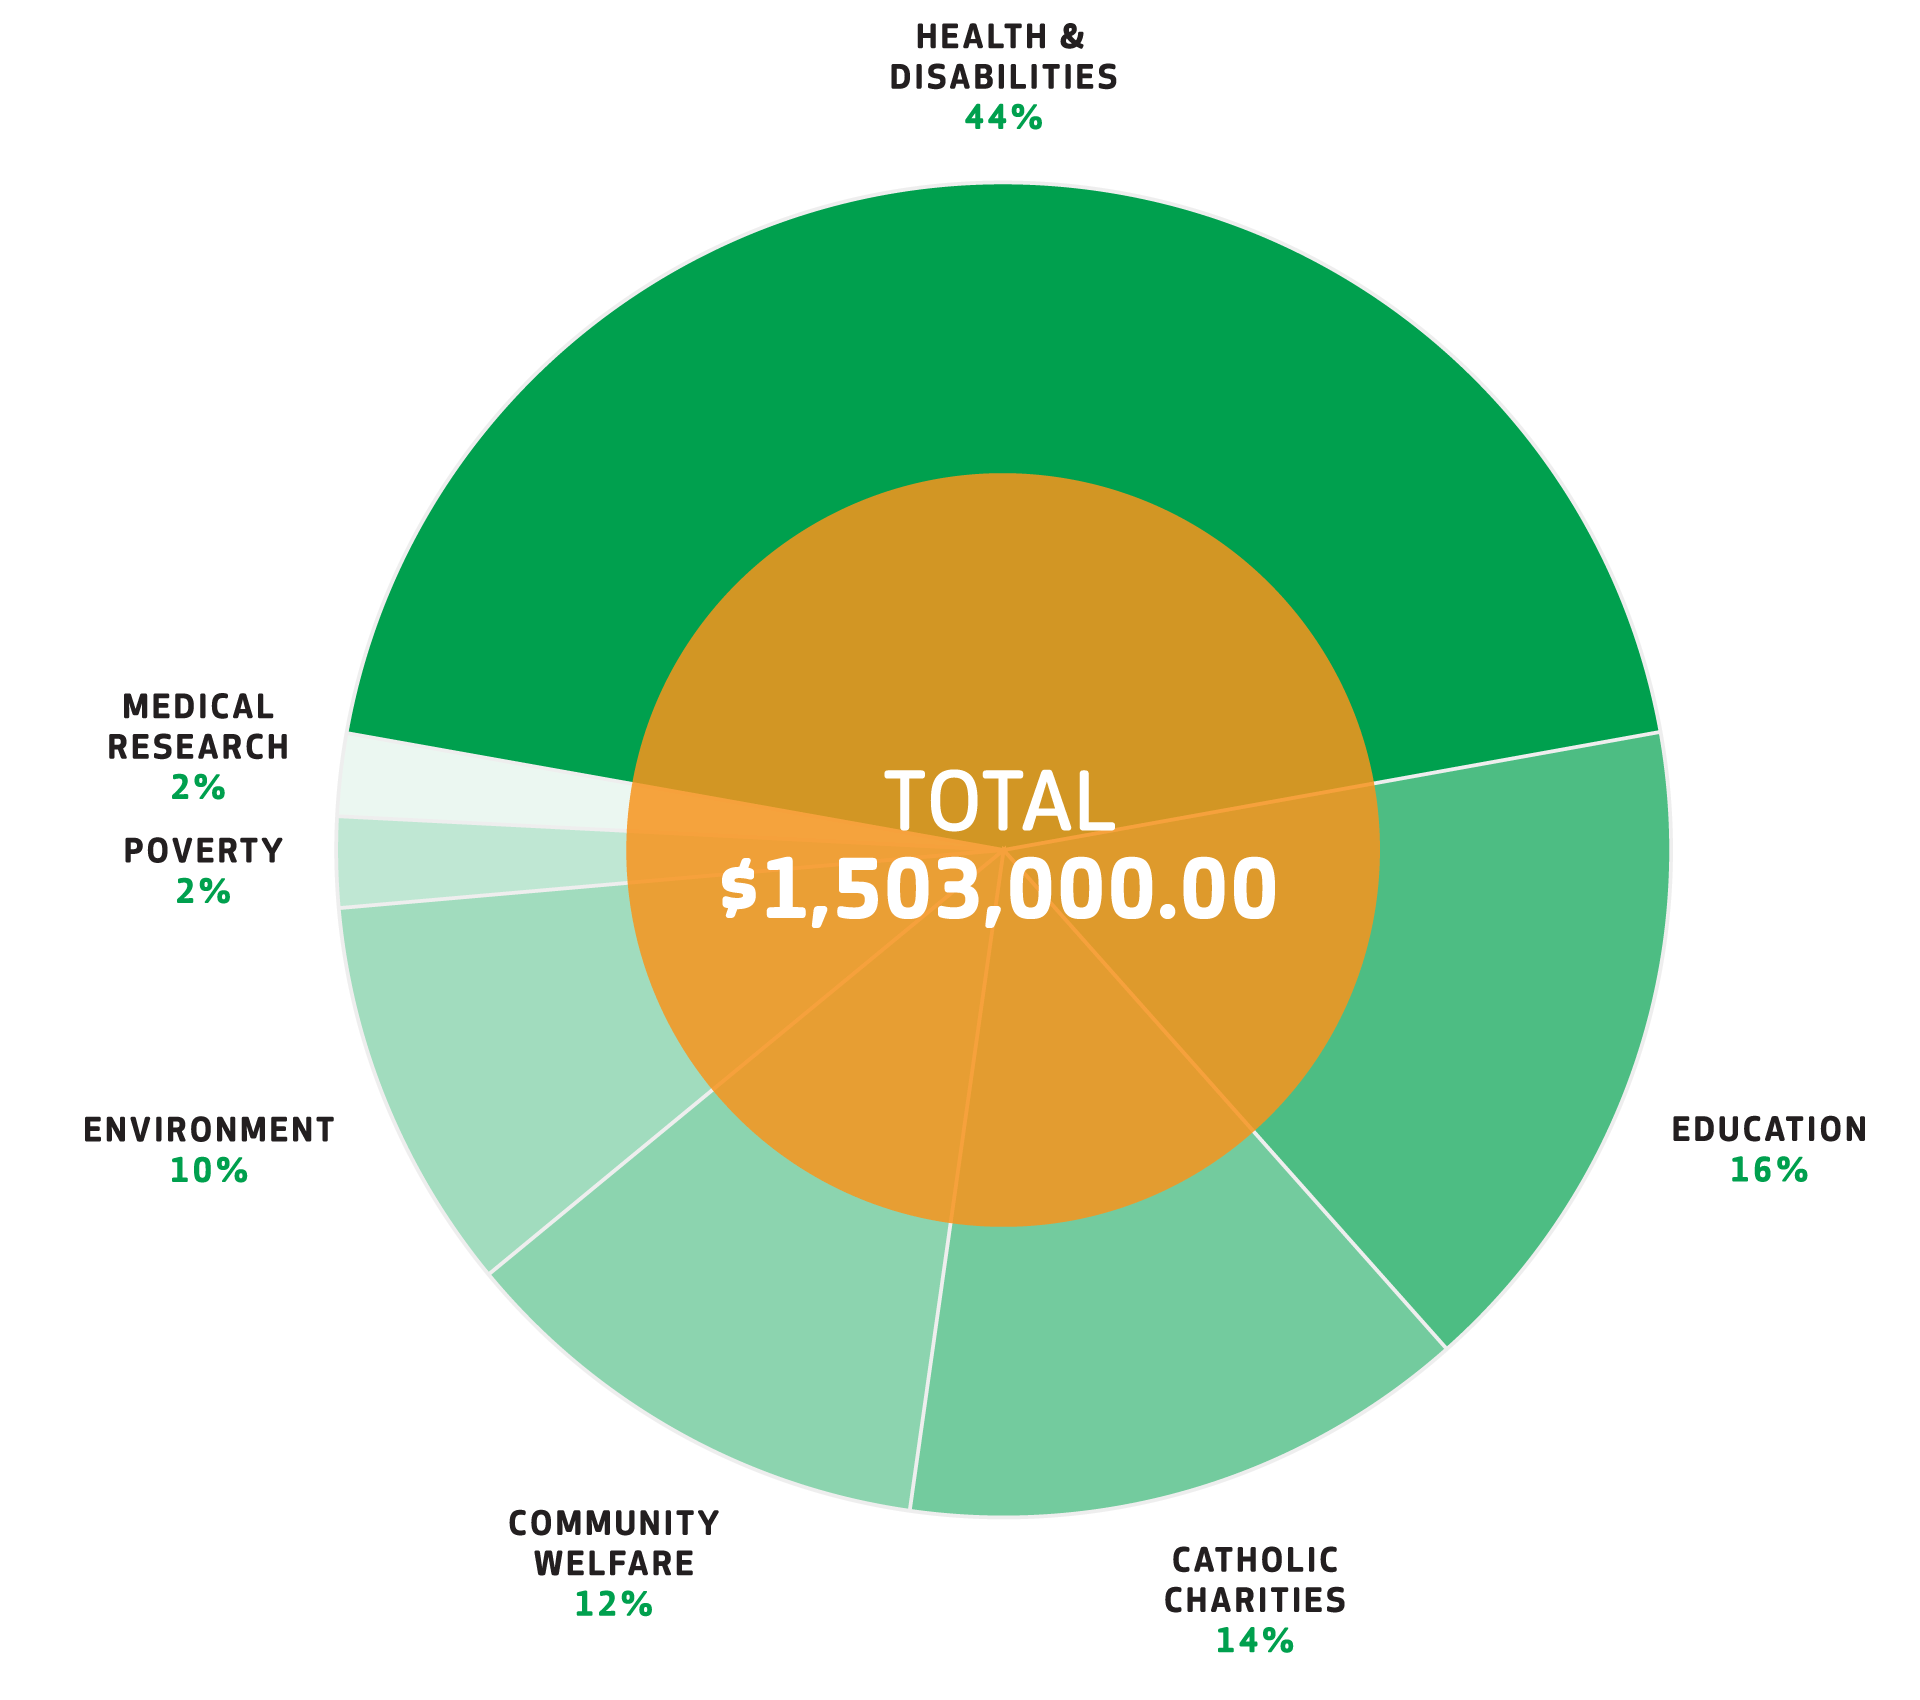
$666,800.00Health & Disabilities (44%)
$244,600.00Education (16%)
$210,000.00Catholic Charities (14%)
$177,100.00Community Welfare (12%)
$144,000.00Environment (10%)
$30,500.00Poverty (2%)
$30,000.00Medical Research (2%)
> DOWNLOAD PDF (28MB)
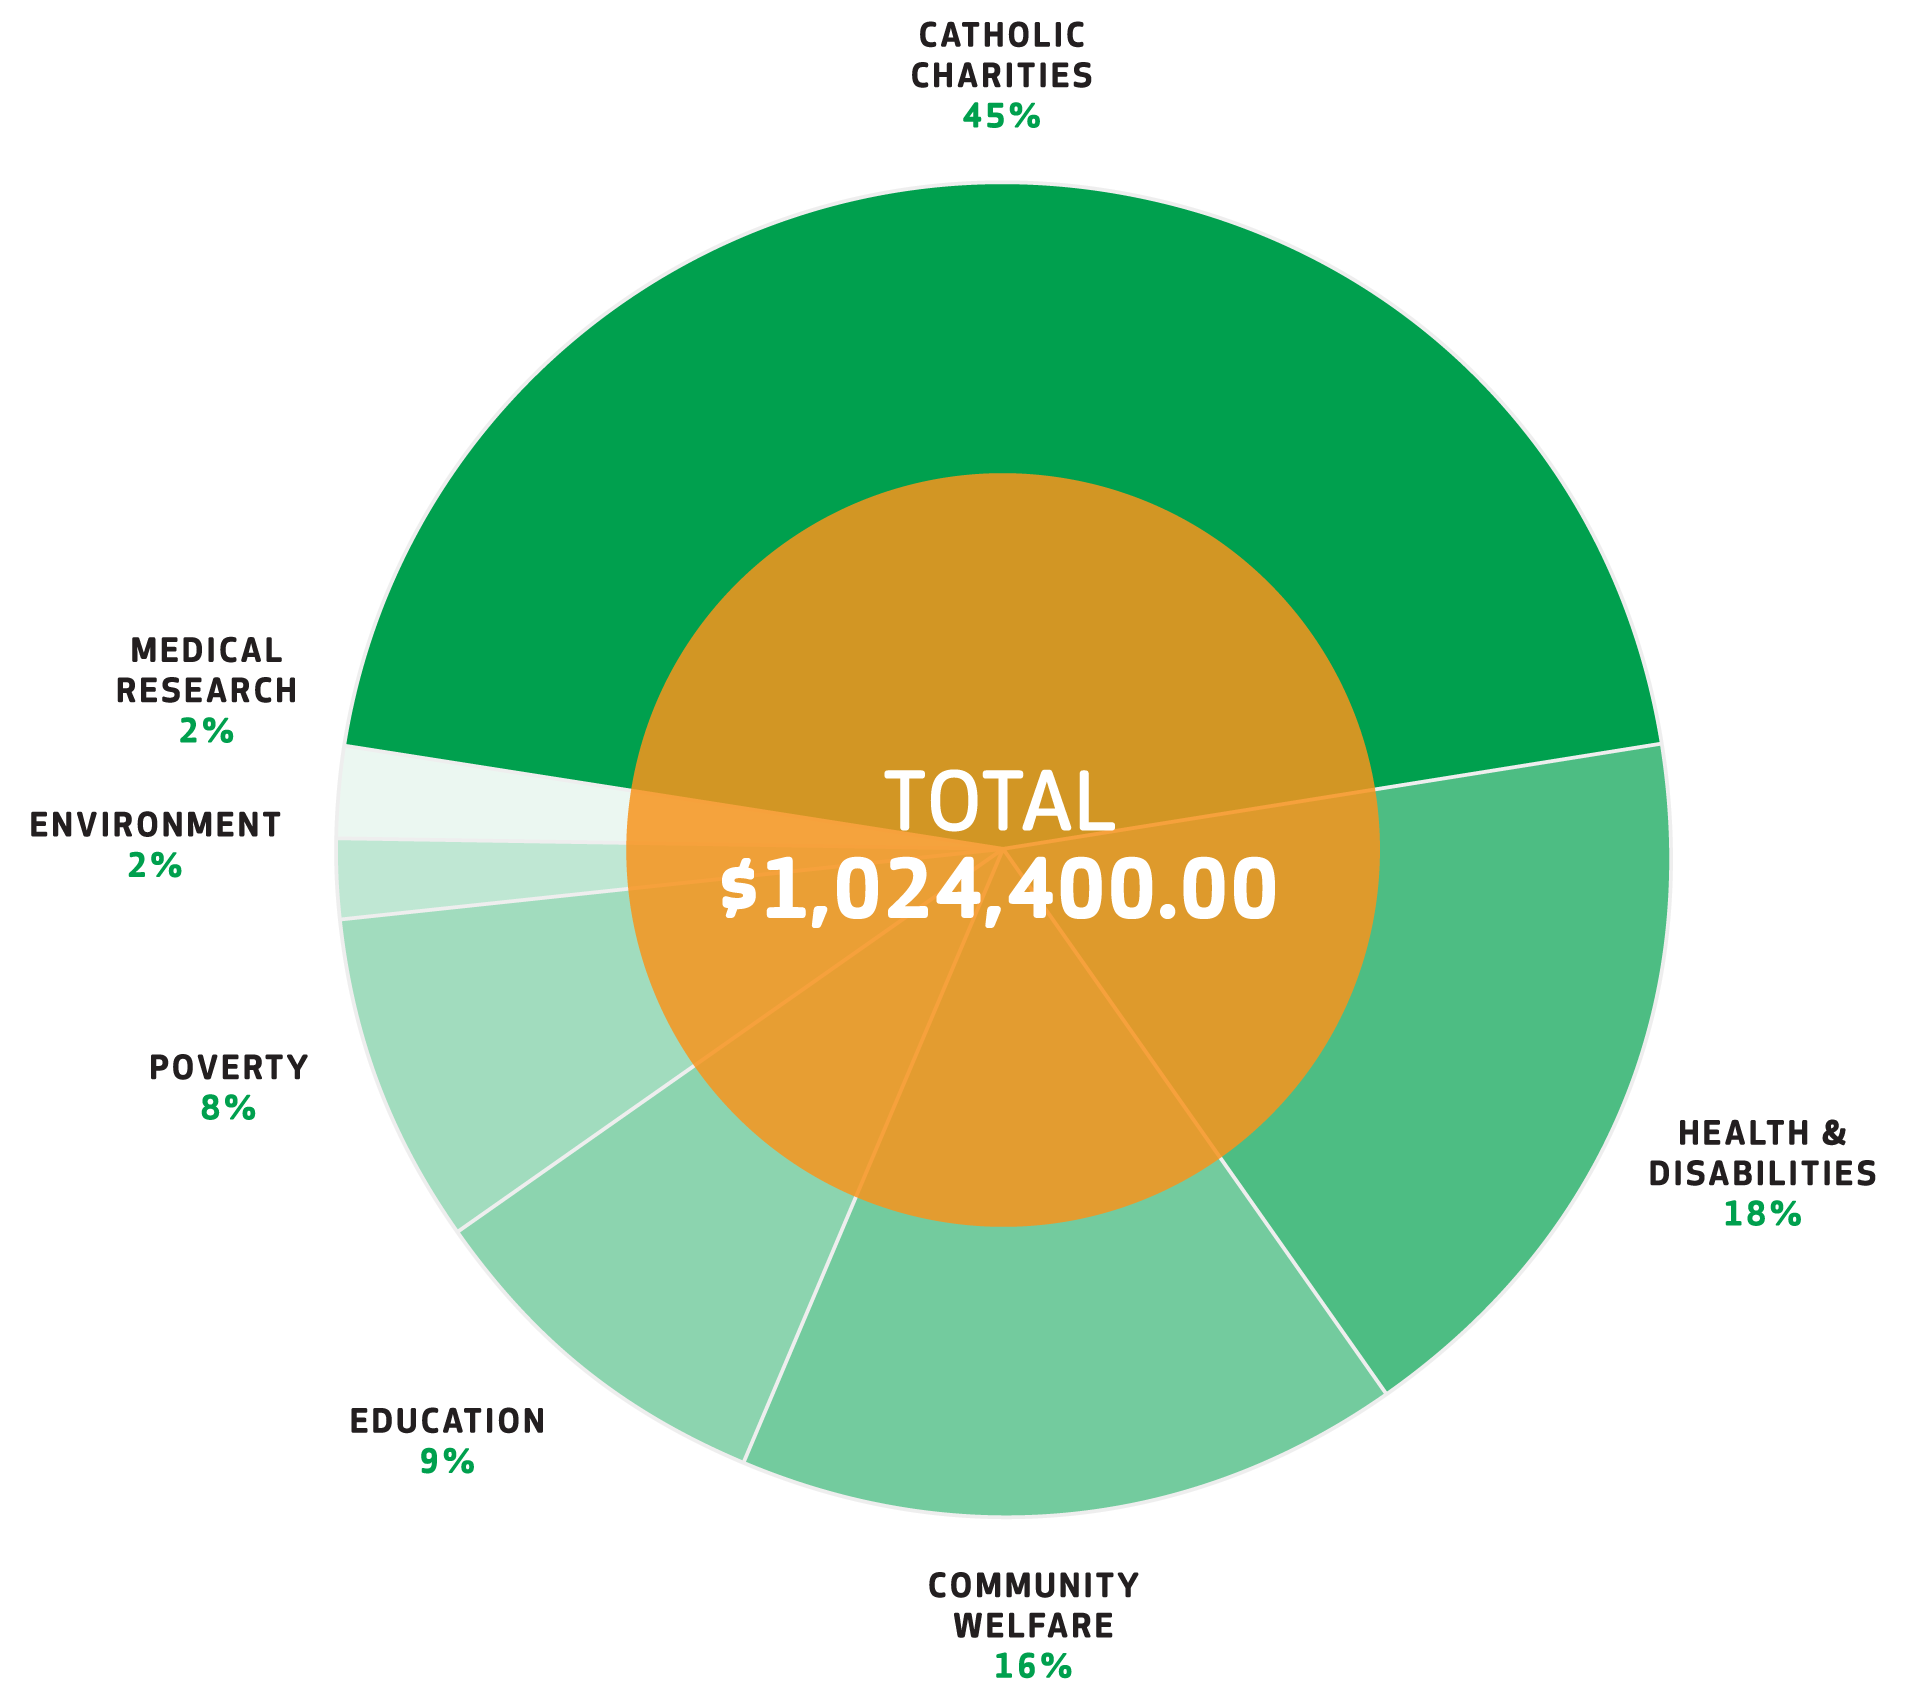
$457,500.00Catholic Charities (45%)
$189,500.00Health & Disabilities (18%)
$161,500.00Community Welfare (16%)
$93,400.00Education (9%)
$85,500.00Poverty (8%)
$20,000.00Environment (2%)
$17,000.00Medical Research (2%)
> DOWNLOAD PDF (26MB)
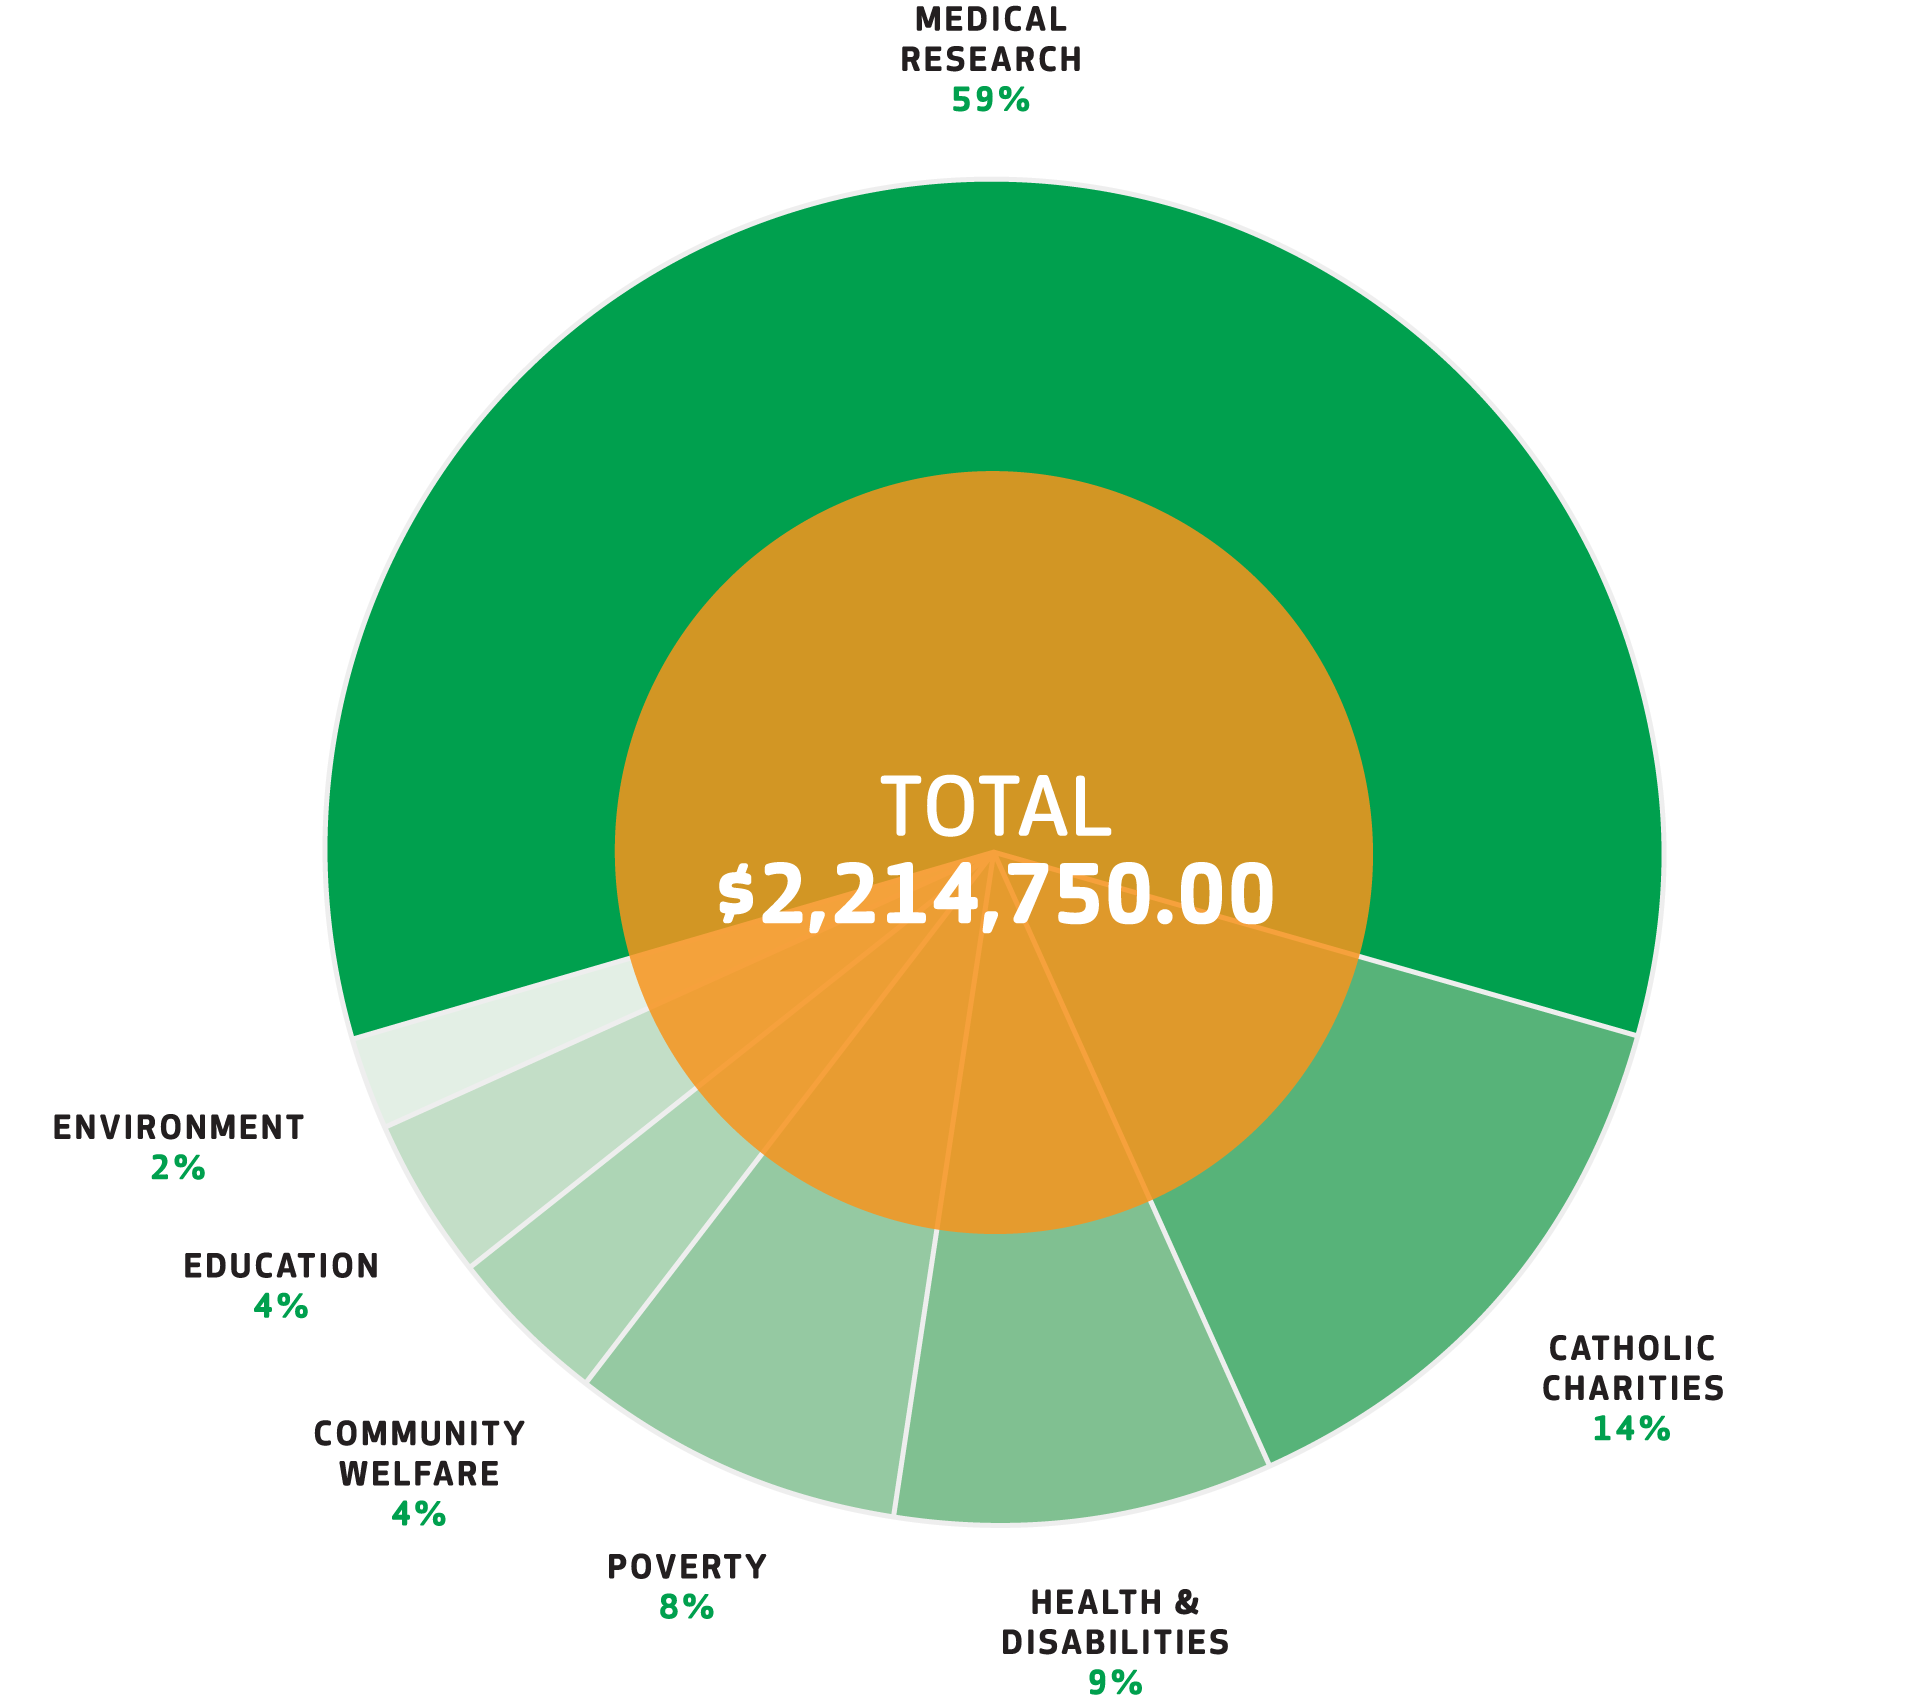
$1,296,900.00Medical Research (59%)
$319,700.00Catholic Groups (14%)
$203,650.00Health & Disabilities (9%)
$181,500.00Poverty (8%)
$97,500.00Community Welfare (4%)
$78,000.00Education (4%)
$37,500.00Environment (2%)
> DOWNLOAD PDF (24MB)
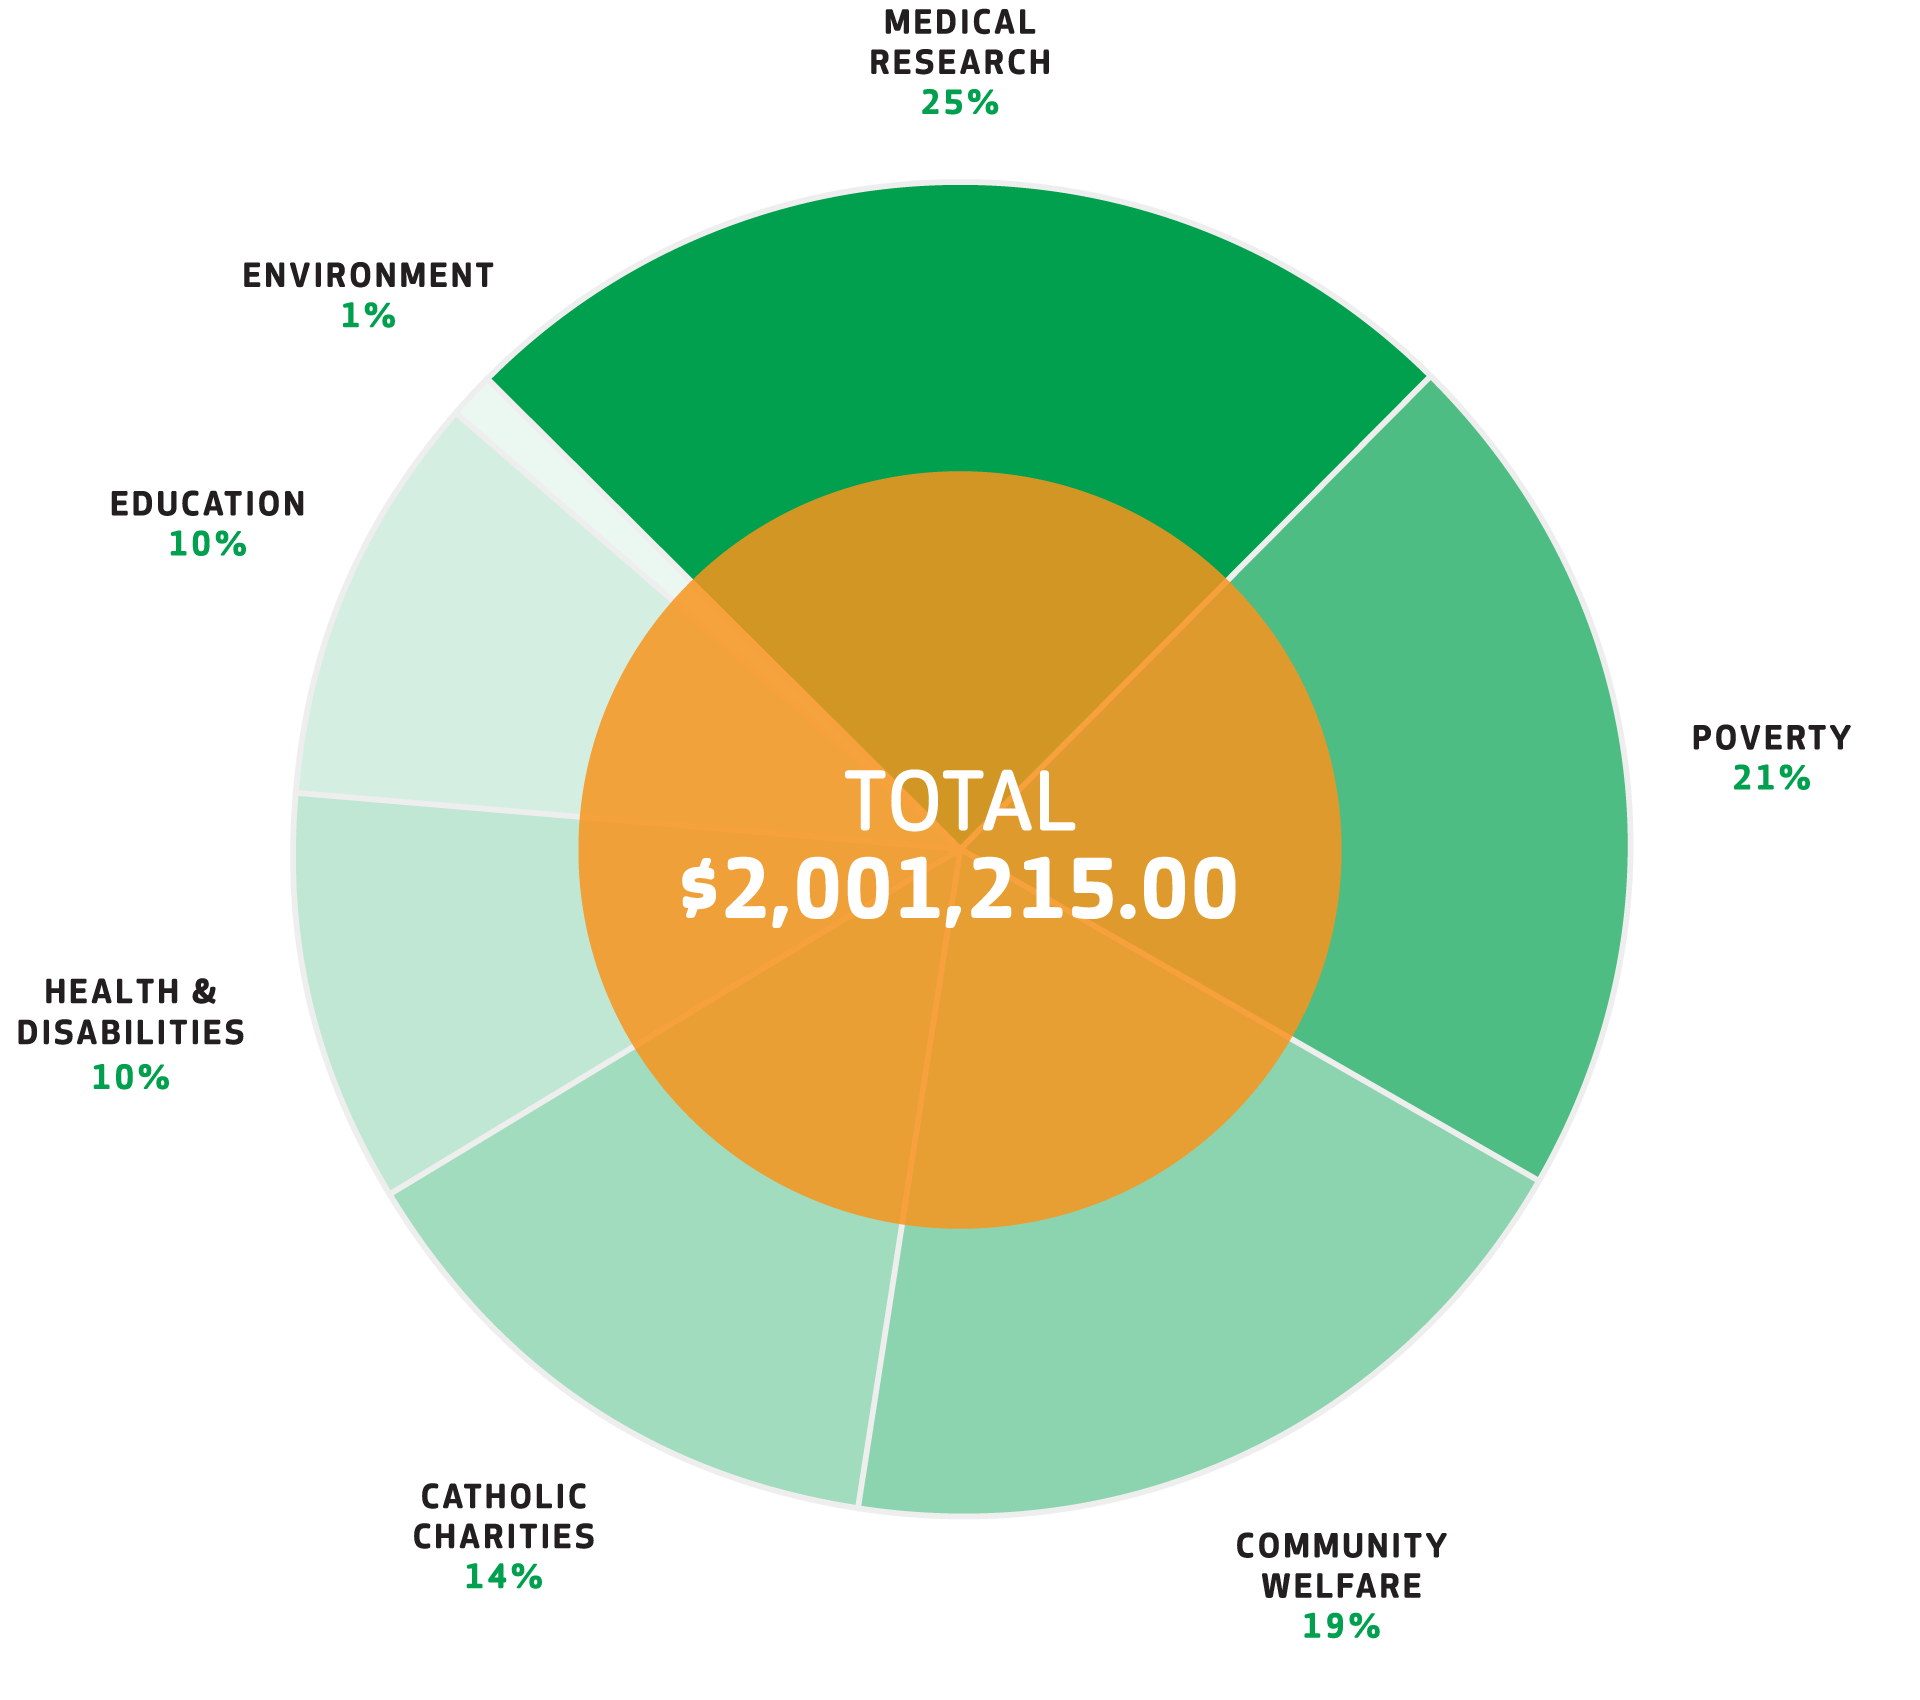
$510,000.00Medical Research (25%)
$421,000.00Poverty (21%)
$373,500.00Community Welfare (19%)
$290,585.00Catholic Groups (14%)
$193,630.00Health & Disabilities (10%)
$192,500.00Education (10%)
$20,000.00Environment (1%)
> DOWNLOAD PDF (22MB)
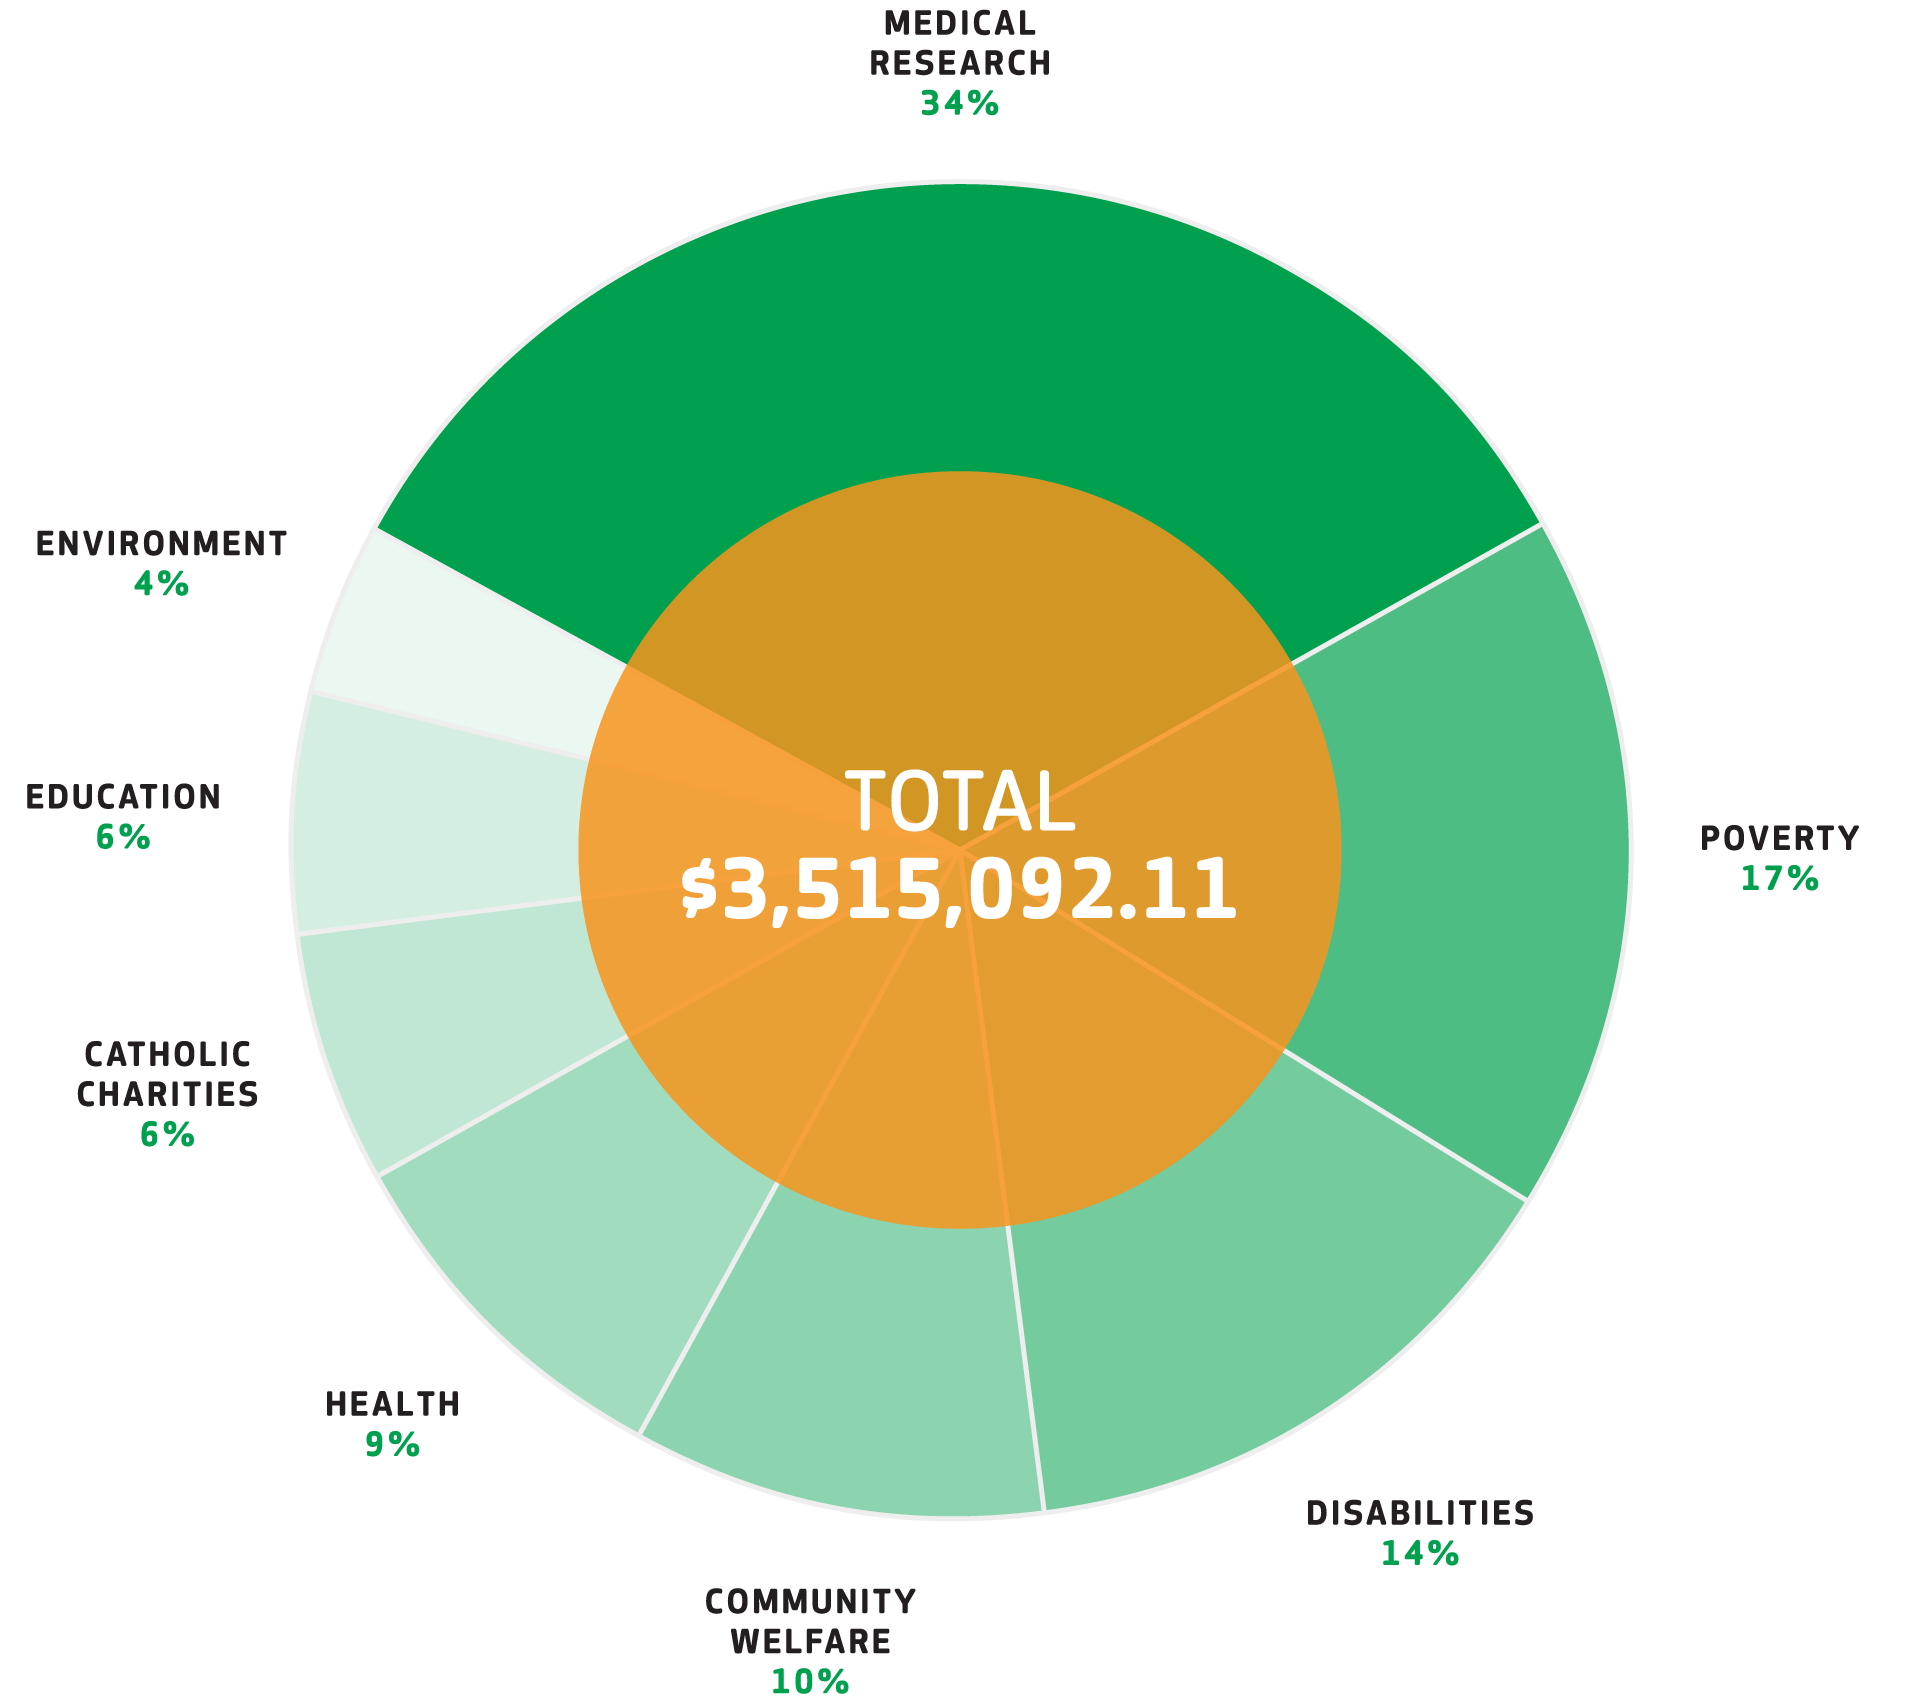
$1,205,800.00Medical Research (34%)
$586,205.00Poverty (17%)
$490,210.00Disabilities (14%)
$317,177.11Community Welfare (10%)
$331,000.00Health (9%)
$238,600.00Catholic Groups (6%)
$219,850.00Education (6%)
$126,250.00Environment (4%)
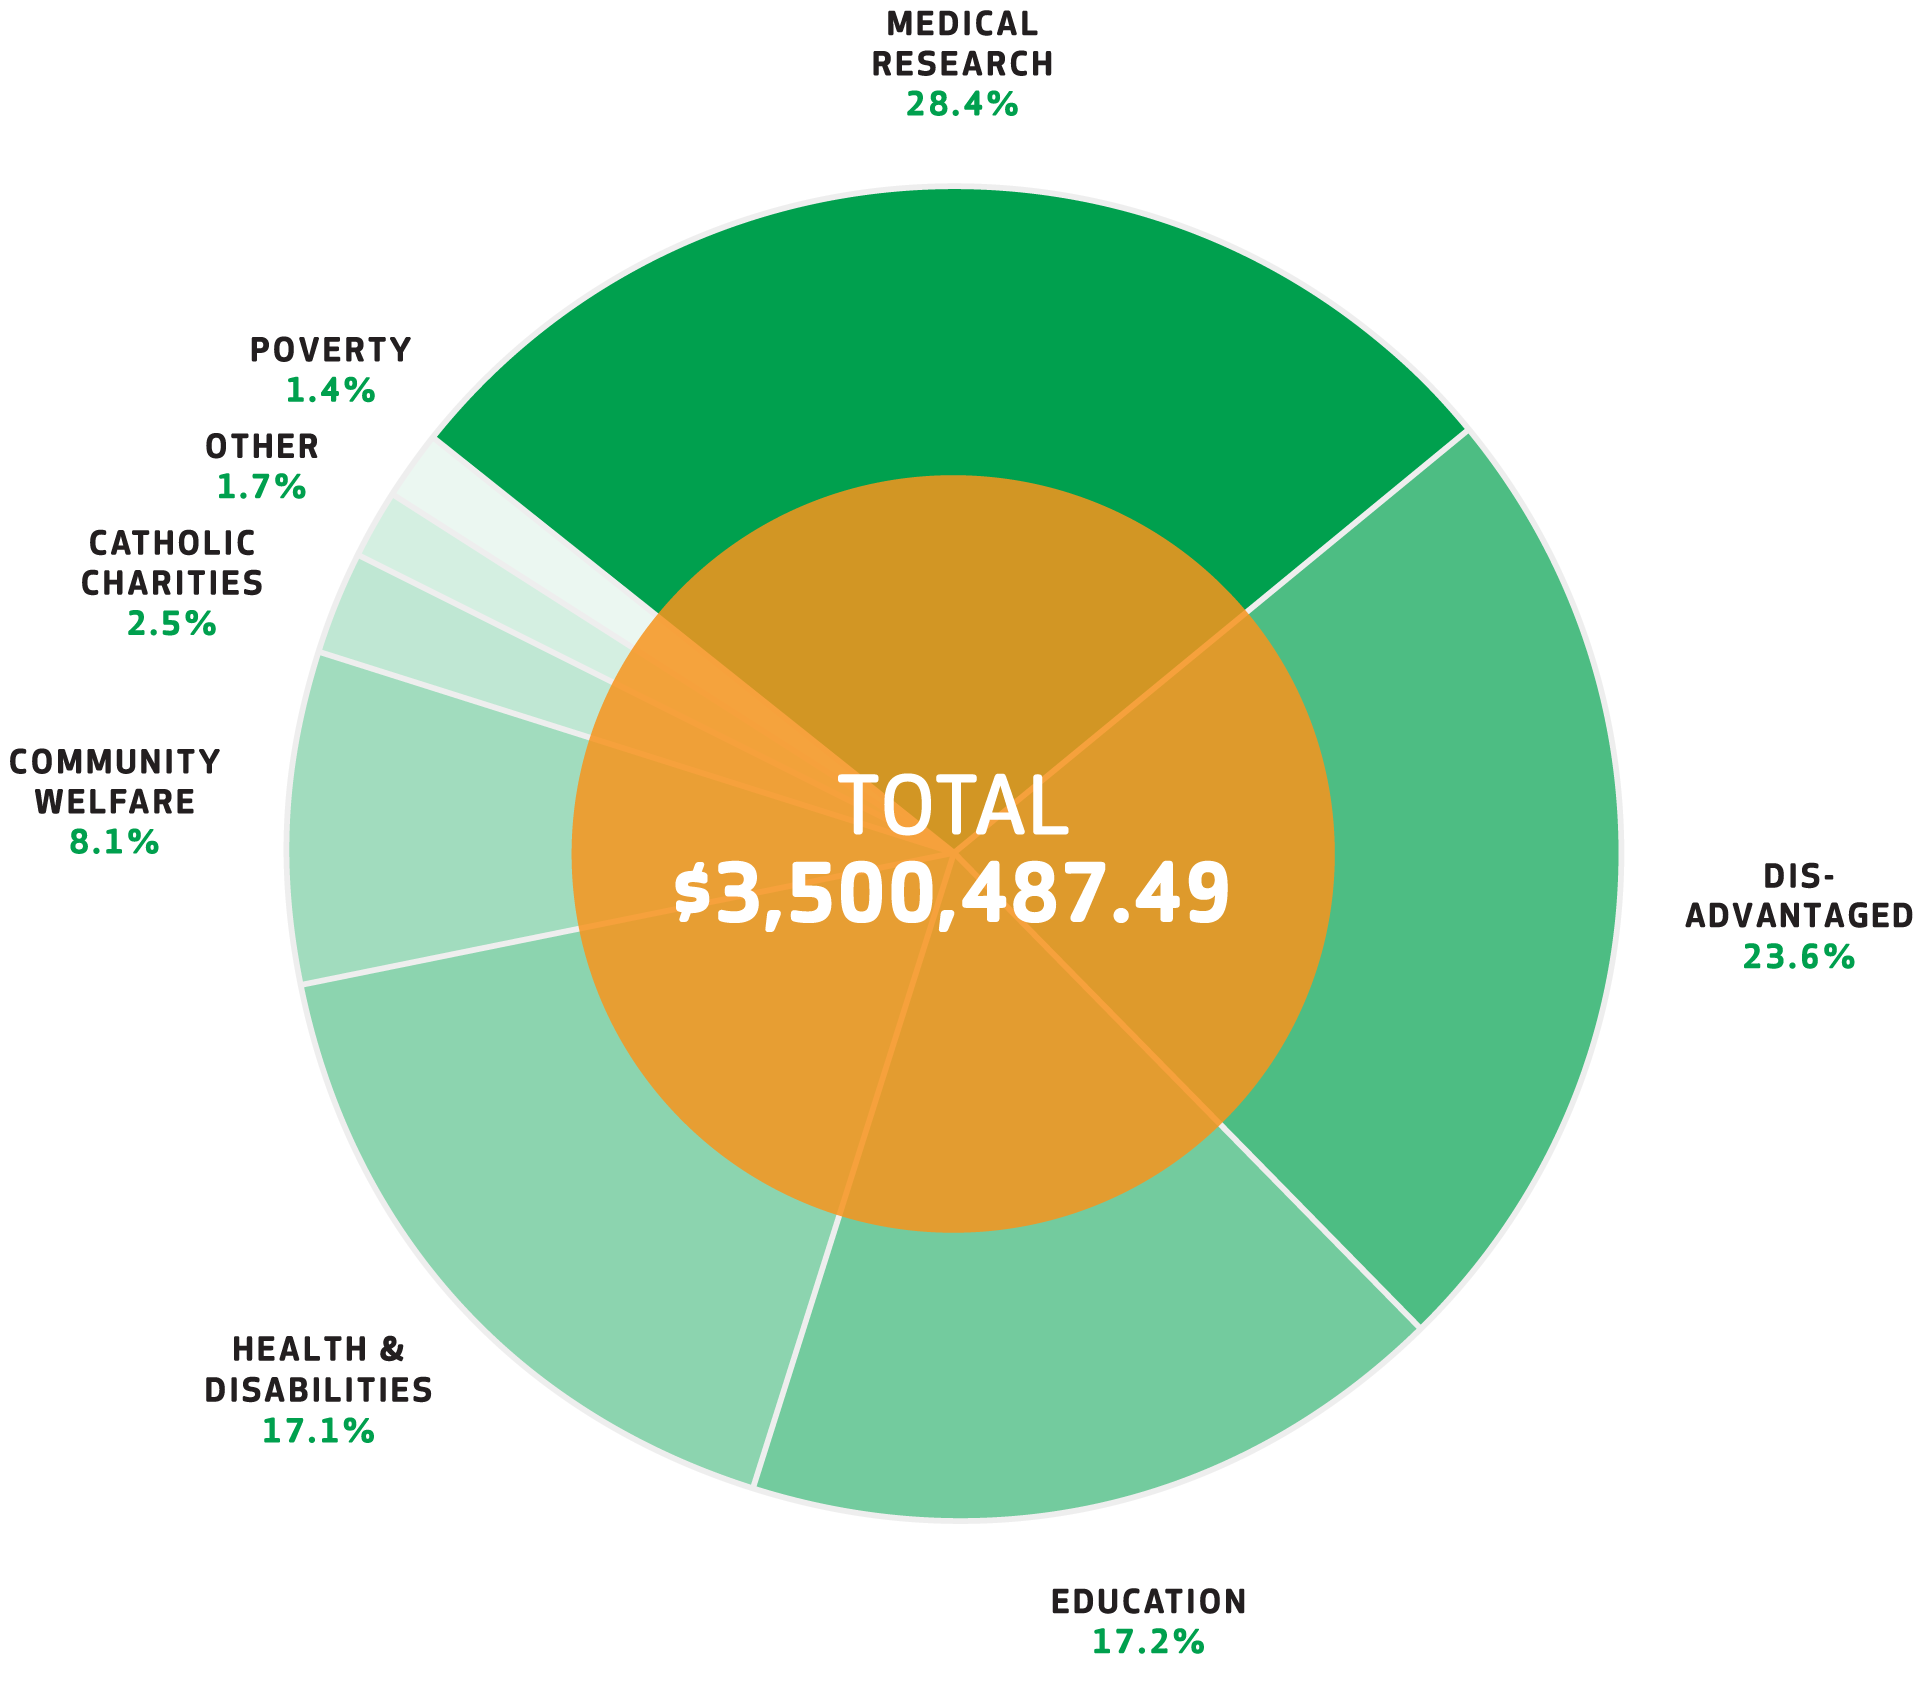
$994,287.50Medical Research (28.4%)
$829,347.00The Disadvantaged (23.6%)
$602,140.49Education (17.2%)
$599,212.50Health & Disabilities (17.1%)
$282,500.00Community Welfare (8.1%)
$87,500.00Catholic Groups (2.5%)
$58,000.00Other Charitable Causes (1.7%)
$47,500.00Poverty (1.4%)
> DOWNLOAD PDF (6MB)
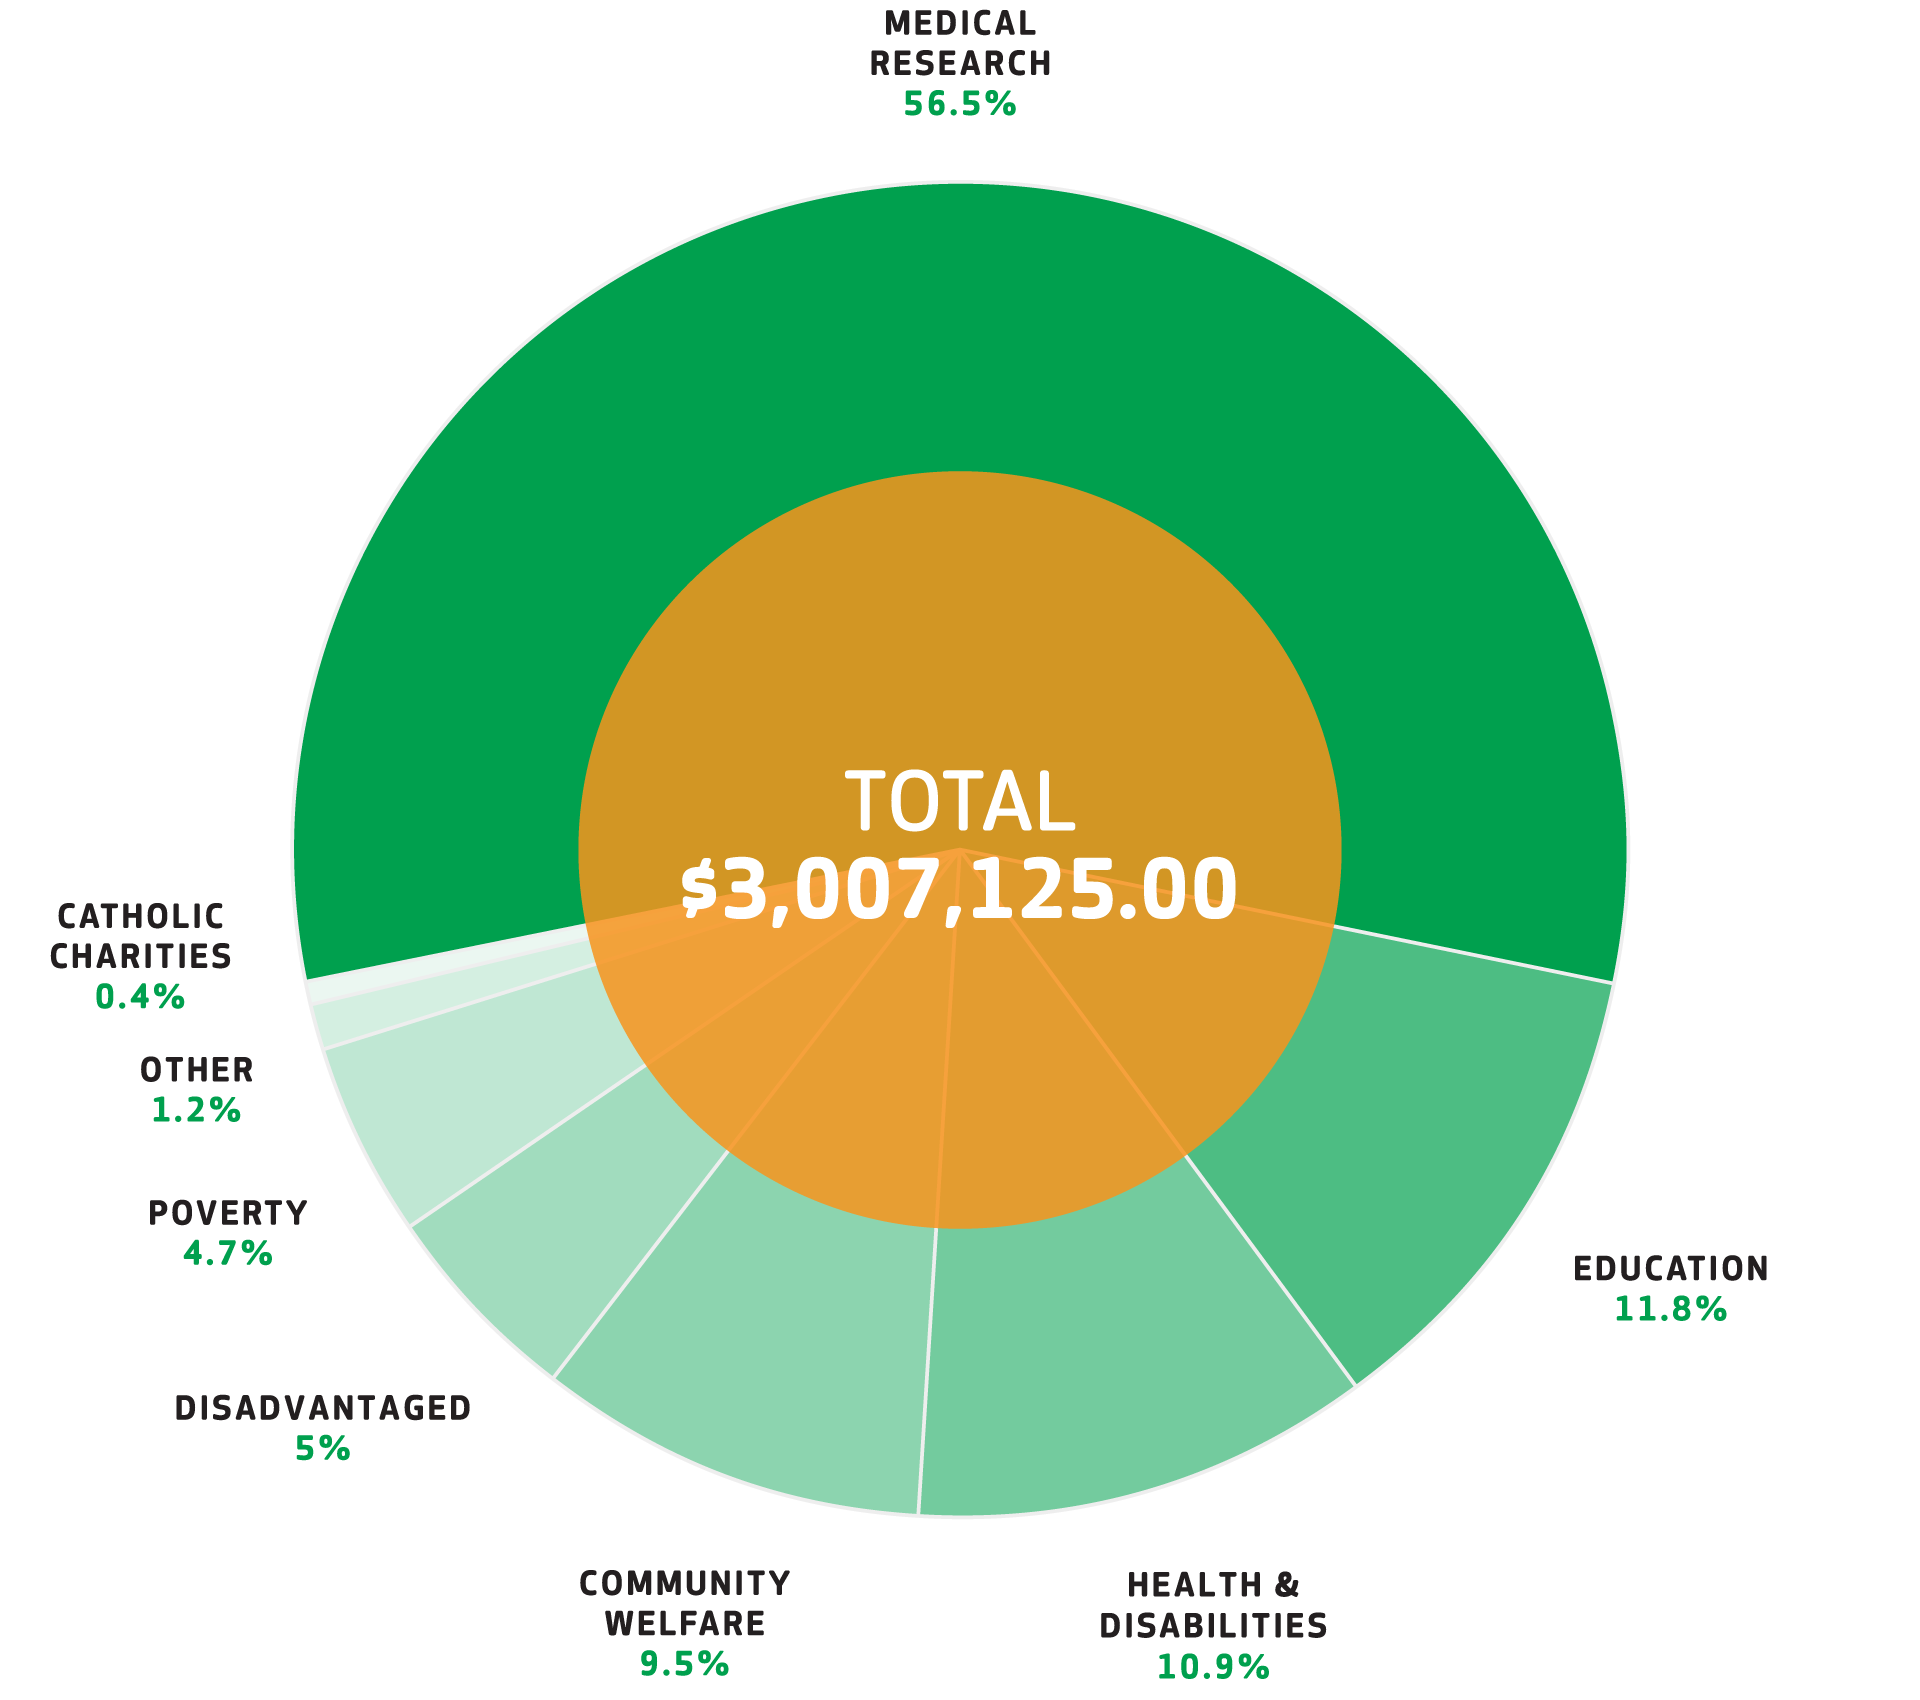
$1,700,000.00Medical Research (56.5%)
$354,500.00Education (11.8%)
$328,750.00Health & Disabilities (10.9%)
$284,560.00Community Welfare (9.5%)
$149,315.00The Disadvantaged (5%)
$140,000.00Poverty (4.7%)
$37,500.00Other Charitable Causes (1.2%)
$12,500.00Catholic Groups (0.4%)